简介
PyR4MDS 全拼是 Python and R for the Modern Data Scientist,大致翻译成中文是「现代数据科学家的 Python 和 R」。如书中序言所讲:
Becoming bilingual in both Python and R is a step toward building bridges among members of the wider data science community.
成为 Python 和 R 的双语者是通向广阔数据科学社区的桥梁。
在学习 R 语言的三年多时光里1,我惊叹于 ggplot2 优美的图形语法,dplyr 和 tidyr 简洁的数据操作,purrr 的高效编程,knitr 的分析即报告,shiny 的动态展示……
当我步入职场,R 让我高效地解决数据清洗、分析、可视化等众多问题。然而我也逐渐意识到 R 在性能、机器学习、文本分析、图像处理等现实问题上的局限。因此,我又回头望向曾经粗略了解过的 Python。
关于「学 Python 还是 R 」的问题在一些社区中的讨论异常激烈,但成年人的选择应该是「我都要」。这本 PyR4MDS 于我而言恰如其时,两百页不到的篇幅从两门语言的起源落笔,讲到如何从现有的一门语言跨到另一门,最终融合成为一个双语玩家。
以下是书中的一些摘录,并通过 ChatGPT 3.5 翻译为中文。
Part 1: Discovery of a New Language
Chapter 1: In the Beginning
FUBU (For Us, By Us) meant community; it meant understanding the needs and desires of your people and making sure you served them well. R is FUBU.
(为我们,由我们)意味着社区;它意味着理解你的用户的需求和欲望,并确保你为他们提供良好的服务。R 就是 FUBU。
Python’s core vision is really that of one person who set out to address common computing problems at the time.
Python 的核心愿景实际上是一个人着手解决当时普遍的计算问题。
Users often forget that Jupyter is short for “Julia, Python, and R” because it’s very Python-centric.
用户经常忘记 Jupyter 是"Julia, Python, and R"的缩写,因为它非常以 Python 为中心。
Although reshape has long since been retired, it was the first glimpse into understanding how data structure influences how we think about and work with our data.
尽管 reshape 早已被淘汰,但它是第一次窥见了数据结构如何影响我们思考和处理数据的方法。
Part 2: Bilingualism 1: Learning a New language
Chapter 2: R for Pythonistas
The RStudio viewer is much nicer than Excel, since it only loads into memory what you’re seeing on the screen. You can search for specific text and filter your data here, so it’s a handy tool for getting a peek at your data.
RStudio 的查看器比 Excel 好得多,因为它只在内存中加载你在屏幕上看到的内容。你可以在这里搜索特定的文本并过滤你的数据,因此它是一个很方便的工具,用来快速查看你的数据。
In R, with a few, but notable, exceptions, . doesn’t mean anything special. It’s a bit annoying if you’re used to more object-oriented programming (OOP) languages where . is a special character.
在 R 中,除了一些明显的例外情况外,
.并没有特殊的含义。如果你习惯于更多面向对象编程(OOP)语言中.作为特殊字符的情况,可能会感到有些烦人。
diamonds$price > 18000: the length of the shorter object, here the unassigned numeric vector 18000 (one element long) will be “recycled” over the entire length of the longer vector, here the price column from the diamonds data frame accessed with $ notation (53940 elements). In Python you may refer to this as broadcasting when using NumPy arrays, and vectorization as a distinct function. In R, we simply refer to both as vectorization or vector recycling.
diamonds$price > 18000:较短对象的长度,也就是未指定的数字向量18000(只有一个元素)将会在较长向量的整个长度上进行"循环",这里的较长向量是通过$符号从diamonds数据框中访问的price列(共有 53940 个元素)。在 Python 中,当使用 NumPy 数组时,您可以将此称为广播,并将向量化作为一个独立的功能。在 R 中,我们只是将两者都称为向量化或向量循环。
As you would expect, in [i,j], i always refers to the rows (observations), and j always refers to columns (variables). Notice that we also mixed two different types of input, but it works because they were in different parts of the expression. We use a logical vector that is as long as the data frame’s number of observations (thank you, vector recycling) to obtain all the TRUE rows, and then we used a character vector to extract a named element; recall that each column in a data frame is a named element. This is a really typical formulation in R.
如您所预期,在
[i,j]中,i总是指行(观察值),而j总是指列(变量)。请注意,我们还混合使用了两种不同类型的输入,但它们工作正常,因为它们在表达式的不同部分。我们使用一个与数据框的观察值数量一样长的逻辑向量(感谢向量循环)来获取所有的TRUE行,然后我们使用一个字符向量来提取一个命名元素;请记住,数据框中的每列都是一个命名元素。这在 R 中是一个非常典型的表达方式。
These functions have existed since the early days of R and reflect, intuitively, what statisticians do all the time. The split data into chunks, defined by some property (rows, columns, categorical variable, objects), then they apply some kind of action (plotting, hypothesis testing, modeling, etc.), and then they combine the output together in some way (data frame, list, etc.). The process is sometimes called split-apply-combine. Realizing that this process kept repeating itself started to clarify for the community how to start thinking about data and, indeed, how to actually organize data. From this, the idea of “tidy” data was born.
这些函数从 R 的早期就存在,直观地反映了统计学家一直在做的事情。将数据按照某种属性(行、列、分类变量、对象)划分为块,然后对其进行某种操作(绘图、假设检验、建模等),最后以某种方式将输出结果组合在一起(数据框、列表等)。这个过程有时被称为拆分-应用-组合。意识到这个过程一直在重复出现,开始为社区澄清如何开始思考数据,实际上如何组织数据。从这个想法中诞生了"整洁"数据的概念。
In Python, you often hear about the Python way (“Pythonic”). This means the proper Python syntax and the preferred method to perform a specific action. This doesn’t really exist in R; there are many ways to go about the same thing, and people will use all varieties! Plus, they’ll often mix dialects. Although some dialects are easier to read than others, this hybridization can make it harder to get into the language.
在 Python 中,你经常听到 “Pythonic” 的说法。这意味着正确的 Python 语法和执行特定操作的首选方法。而在 R 中,实际上并不存在这种概念;有很多方法可以完成相同的事情,人们会使用各种各样的方法!而且,他们经常混合使用不同的风格。尽管有些风格比其他风格更容易阅读,但这种混合使用可能使人们更难入门该语言。
Chapter 3: Python for UseRs
Here, we make the argument that text editors will serve you better in the long run.
在这里,我们认为文本编辑器在长期使用中会更好地为您服务。
In R, a library is a collection of individual packages. The same holds true for Python, but the use of library and package is not as strict. A package is a collection of modules. This is useful to know since we can load entire package or just a specific module therein. Thus, in general: library > package > module.
在 R 中,一个库(library)是由多个个别包(package)组成的集合。Python 也是一样,但对于 “library” 和 “package” 的使用并不那么严格。一个包是模块(module)的集合。了解这一点很有用,因为我们可以加载整个包或其中的特定模块。因此,一般来说:library > package > module。
Jupyter Notebooks are built on the backbone of IPython, which originated in 2001. Jupyter, which stands for JUlia, PYThon, and R, now accommodates dozens of programming languages and can be used in the JupyterLab IDE or straight-up Notebooks in Jupyter. Notebooks allow you to write text using markdown, add code chunks, and see the inline output. It sounds a lot like R Markdown! Well, yes and no. Under the hood, an R Markdown is a flat text file that gets rendered as an HTML, DOC, or PDF. Notebooks are exclusively JSON-based HTML and can natively handle interactive components. For useRs, this is kind of like an interactive R Markdown with a shiny runtime by default. This means that you don’t compose a notebook as a flat text file, which is an important distinction when considering editing potential.
Jupyter Notebook 是建立在 IPython 的基础上的,IPython 起源于 2001 年。Jupyter 代表着 JUlia、PYThon 和 R,现在可以支持几十种编程语言,并且可以在 JupyterLab IDE 或 Jupyter 中的 Notebooks 中使用。Notebooks 允许您使用 Markdown 编写文本,添加代码块,并查看内联输出。这听起来很像 R Markdown!是的,也不完全是。在内部,R Markdown 是一个扁平的文本文件,会被渲染为 HTML、DOC 或 PDF 格式。而 Notebooks 是基于 JSON 的 HTML 格式,并且可以原生地处理交互式组件。对于 R 用户来说,这有点像默认带有 shiny 运行时的交互式 R Markdown。这意味着您不需要将 Notebook 作为一个扁平的文本文件来组织,这在考虑编辑潜力时是一个重要的区别。
A method is a function that is called by an object.
方法(method)是由对象调用的函数。
plant_growth.shape In this case, we are calling attributes of the object, so they don’t receive any brackets. So here we see that any given object can call permissible methods and attributes, according to its class.
在这种情况下,我们调用了对象的属性,因此它们不接受任何括号。因此,在这里我们可以看到,任何给定的对象根据其类别可以调用可允许的方法和属性。
{'weight': ['mean', 'std']} is a dictionary (class dict). You can think of this as a key-value pair, defined here using {}. Dictionaries are data storage objects in their own right, are part of standard vanilla Python, and as we see here are used as arguments to input in methods and functions. This is similar to how lists in R are used for both data storage and as a list of arguments in specific circumstances. Nonetheless, a dictionary is better thought of as an associative array since indexing is only by key, and not number. I may go so far as to say that a dictionary is even more like an environment in R since that contains many objects but no indexing, but that may be a bit of a stretch.
{'weight': ['mean', 'std']}是一个字典(dict 类)。您可以将其视为键-值对,使用{}进行定义。字典是数据存储对象,是标准的纯 Python 一部分,正如我们在这里看到的,它们被用作方法和函数的输入参数。这与 R 中列表的使用方式类似,列表既用于数据存储,也用作特定情况下的参数列表。尽管如此,字典更适合被看作是关联数组,因为它的索引只能通过键进行,而不是数字。我可能会进一步说,字典更像是 R 中的环境(environment),因为它包含许多对象但没有索引,但这可能有点牵强。
Part 3: Bilingualism 2: The Modern Context
Chapter 4: Data Format Context
There is a danger in overusing third-party packages, and you have to be aware of when the right time to go back to the basics is. Otherwise, you might fall victim to a false sense of security and become reliant on the training wheels provided by tools such as pandas. This might lead to difficulties when dealing with more specific real-world challenges.
过度使用第三方包存在风险,你必须意识到何时是回归基础知识的正确时机。否则,你可能会陷入虚假的安全感中,并依赖于诸如 pandas 等工具提供的扶助。这可能在处理更具体的现实挑战时导致困难。
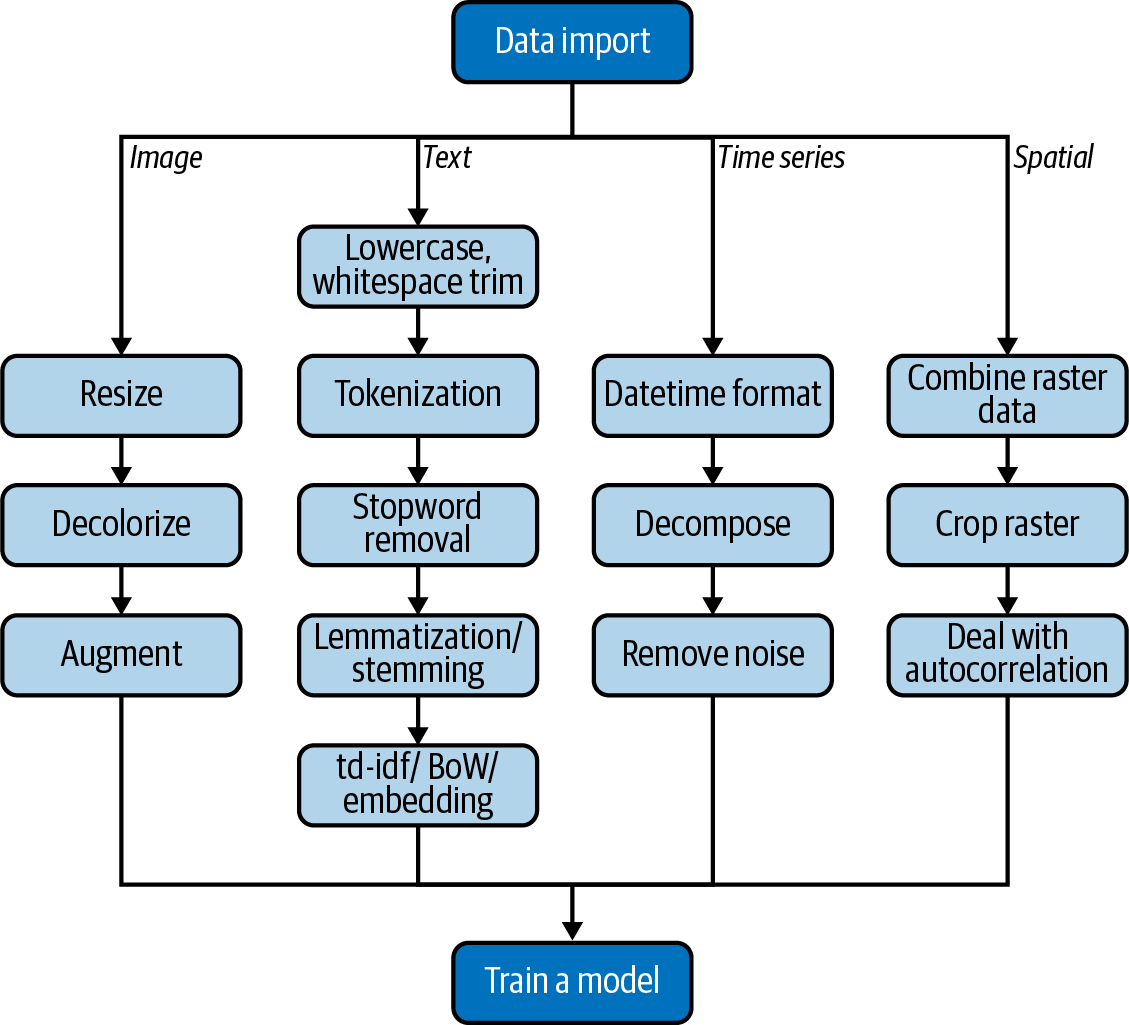
Image Data
Here are the steps of our task:
-
Resize the image to a specific size.
-
Convert the image to black and white.
-
Augment the data by rotating the image.
They will differ in some way or another – such as size and/or color. Steps 1 and 2 in our task list help us deal with that. Step 3 is handy for ML applications. The performance (i.e., classification accuracy, or area under the curve [AUC]) of ML algorithms depends mostly on the amount of training data, which is often in little supply. To get around this, without resorting to obtaining more data, data scientists have discovered that playing around with the data already available, such as rotating and cropping, can introduce new data points. Those can then be used to train the model again and improve performance. This process is formally known as data augmentation.
Here we can observe an important feature the already provides advantages to using Python for CV tasks as opposed to R. The image is directly stored as a NumPy multidimensional array (nd stands for n-dimensions), making it accessible to variety of other tools available in the wider Python ecosystem. Because this is built on the PyData stack, it’s well supported.
print(type(single_image))
#> numpy.ndarray
这是我们任务的步骤:
调整图像大小为特定尺寸。
将图像转为黑白。
通过旋转图像来增强数据。
它们在某种程度上会有所不同,比如大小和/或颜色。我们任务清单中的第 1 步和第 2 步帮助我们处理这个问题。第 3 步对于机器学习应用非常有用。机器学习算法的性能(如分类准确率或曲线下面积 [AUC])主要取决于训练数据的数量,而这往往很少。为了解决这个问题,数据科学家发现,通过对已有的数据进行旋转和裁剪等操作,可以引入新的数据点。然后可以再次使用这些数据点对模型进行训练,以提高性能。这个过程被正式称为数据增强。
在这里,我们可以观察到一个对使用 Python 进行计算机视觉(CV)任务相比于 R 而言的重要特性。图像直接以 NumPy 多维数组(nd 代表 n 维)的形式存储,这使得它可以被广泛 Python 生态系统中的其他工具所使用。由于这是构建在 PyData 堆栈之上的,所以它得到了很好的支持。
Spatial Data
One of the most common issues when working in machine learning (ML) is correlations within the data. The fundamental assumption for a correct dataset is that the individual observations in the data are independent from each other to obtain accurate statistical results. However, this assumption is often violated in spatial data due to its inherent nature. This issue is known as spatial autocorrelation. To mitigate this risk, there are several packages available for sampling from the data.
在机器学习中,最常见的问题之一是数据中的相关性。一个正确的数据集的基本假设是数据中的各个观测值是相互独立的,以获得准确的统计结果。然而,在空间数据中,由于其固有性质,这个假设经常被违反。这个问题被称为“空间自相关”。为了减轻这个风险,有几个可用的包可以从数据中进行抽样。
Chapter 5: Workflow Context
When to use a GUI for exploratory data analysis (EDA)? Many data scientists frown upon the idea of using a GUI for their daily work. They prefer the flexibility and utility of command-line tools. However, there is one area where using a GUI makes more sense in terms of productivity, and that is EDA. Generating multiple plots can be time-consuming, especially at the beginning of a data science project where dozens or even hundreds of plots may be needed. Writing code for each plot, even with code organization improvements, can be tedious. For larger datasets, using a GUI like AWS QuickSight or Google Data Studio can be much easier. With a GUI, data scientists can quickly generate a lot of plots and then write the code for the selected ones. There are also good open-source GUI tools available, such as Orange.
在进行探索性数据分析(EDA)时何时使用图形用户界面(GUI)?许多数据科学家对于在日常工作中使用 GUI 持有不赞成的态度。他们更喜欢命令行工具的灵活性和实用性。然而,在一个领域中,使用 GUI 更具有生产力的原因是 EDA。生成多个图表可能非常耗时,特别是在数据科学项目的开始阶段,可能需要创建几十甚至几百个图表。为每个图表编写代码即使通过改进代码组织方式,也会很繁琐。对于较大的数据集,使用 AWS QuickSight 或 Google Data Studio 等 GUI 工具可能会更容易。使用 GUI,数据科学家可以快速生成许多图表,然后为选定的图表编写代码。还有一些开源的好的 GUI 工具可用,例如 Orange。
While data engineering (DE) is a vast field, we’ll focus on a specific subset in this section, which is model deployment. Model deployment is the most common DE workflow in which data scientists may need to participate. So, what is ML deployment? In most cases, it involves creating an application programming interface (API) and making it available to other applications, either internally or externally (for customers, this is referred to as “exposing” an API to be “consumed”). ML models are commonly deployed using a representational state transfer (REST) interface.
虽然数据工程(DE)是一个广泛的领域,但在本节中,我们将专注于其中的一个子集,即模型部署。模型部署是数据科学家可能需要参与的最常见的数据工程工作流程。那么,什么是机器学习部署?在大多数情况下,它涉及创建一个应用程序编程接口(API)并使其可供其他应用程序使用,无论是内部还是外部(对于客户来说,这被称为“公开”一个 API 以供“消费”)。机器学习模型通常使用表征状态转移(REST)接口进行部署。
Part 4: Bilingualism 3: Becoming Synergistic
Chapter 6: Using the Two Languages Synergistically
It’s necessary to consider simplifying a workflow and having a good reason to use multiple languages. Deciding when and why to combine Python and R has come up throughout this book.
在工作流程中,考虑简化和合理使用多种编程语言是很重要的。在整本书中,我们一直在讨论何时以及为何将 Python 和 R 结合使用的问题。
For more complex data structures, you can export one or more R objects as an RDATA or RDS format file. The python pyreadr package provides functions to import these files and provide access to each object stored in a dict.
对于较为复杂的数据结构,你可以将一个或多个 R 对象导出为 RDATA 或 RDS 格式文件。Python 的 “pyreadr” 包提供了导入这些文件并访问存储在类似字典结构中的每个对象的函数。
Chapter 7: A Case Study in Bilingual Data Science
There are features in the dataset that might be informative to a data analyst but are at best useless for training the model, and at worst can reduce its accuracy. This is called adding noise to the dataset, and we want to avoid it at all costs. This is the purpose behind feature engineering.
在数据集中可能存在对数据分析人员具有信息价值但对训练模型来说无用甚至可能降低准确性的特征。这被称为给数据集"添加噪音",我们要尽量避免这种情况发生。这就是特征工程的目的所在。
-
从 2019 年 11 月开始。 ↩︎